Sites

Select a specific site/cemetery:

  • Clicking the name in the list gets you to the detailed site view.
  • The map icon gets you to the detailed map of the cemetery.
  • Moving the cursor over the name in the list will highlight a map marker on the site's position and show a description of the site in a tooltip.
  • You can filter the list by entering text (e.g. names or categories) into the search field and by adjusting the “begin” and “end” timespans of the respective sites with the time sliders.
  • On the map the sites are shown as well and can be selected by clicking on the respective markers.
    With the top right button of the map you can select between markers, clustered markers and a density representation of the sites.
  • Furthermore, you also can sort the site list alphabetically by name, type, begin or end time as well as by the count of graves.
  • The list length can be adjusted at the top and you can select the list pages at the bottom of the list.

Detailed View

Each entity (cemetery, grave, burial, find - see data model for further information) in the database has its own detailed page with a permanent link. This page can be accessed from throughout the whole application either by clicking the entity's link in the respective lists or the link icon (e.g. from within the map view). Here you get a structured overview including descriptions, classifications, spatial and chronological position along with subunits and further metadata (e.g. bibliographical sources, external references etc.). Moving the cursor over a certain element will display a tooltip with further explanations.

displays information on the copyright respectively a recommendation on how to cite this page.

saves a GeoJSON file of the entity to your computer.

Map opens the map of the cemetery containing the entity.

If available, images of the entity are shown next to the description. In case there is more than one image there are slider buttons to navigate. Clicking the images opens them in a popup. The source of the image is shown as tooltip respectively in the popup.

A static map with the entity's position and the site's location on a mini map is shown next to it. Clicking into the map also opens the detailed and interactive cemetery map.

List of Subunits

The list of subunits organises all respective entities (e.g. graves, burials or finds) of a superior unit in a table, much like the site list on the sites page, with the information on name, type, begin and end date as well as number of finds, allowing again to sort the list by any of those characteristics. By clicking on the respective entity name you will be directed to the detailed view of the chosen entity.

Catalogue

By selecting the catalogue tab, the view changes to a catalogue view which lists not only the next but all subunits, contained in the parent unit down to the find-level. From here, again the detailed view of the respective unit can be accessed by clicking on the entity name.

Osteology

If the selected entity is a burial respectively if there is distinctive information on human remains, then an additional tab is shown with the associated data. E.g. if there are anthropological attributes (pathologies etc.) for single bones or parts of the skeleton they are shown here. Every bone that has a certain attribute is highlighted on the skeleton schema. Next to the schema a list with further information on the respective bone is displayed.

Human remains

Metadata

Besides these data on actual archaeological entities also metadata are stored and each entity, where applicable, is linked to the respective sources, external references, accompanying files and to the license that applies to the respective digital object.

Metadata

Wherever possible, THANADOS provides its content under a Creative Commons Attribution 4.0 International License. Of course, if for certain objects another copyright applies this is documented in the database and shown in the frontend. The frontend provides persistent URLs for each entity respectively its representation in the browser.

Maps

Each cemetery in THANADOS has its own map representation with a permanent link. It can be accessed either from the detailed view or via the map icon in the list on the sites page.

Technically these maps are based on Leaflet along with various plugins.

Map

Depending on the spatial information that is available for each cemetery the respective graves are displayed here as polygons on a background map. Given the case, that the graves' locations are not documented, then only the cemetery's approximate center is shown as a marker on the map.

Options

On the map, several buttons allow for the following options:

shows/hides the sidebar.

displays a citation recommendation and copyright info.

allows you to download the map as image file either in A4 portrait or A4 landscape format. The image quality depends on your screen resolution. Please note that in some browsers the map background is not rendered completely on the first try. If your exported image shows blank parts please repeat the export. Currently only the map and its content (graves, markers...) are exported. If you need the legend as well as buttons and other map elements that are shown on your screen, you could create a screenshot. Also here the resolution of the image depends on your screen resolution.

opens a dialog to search/filter/visualise data. See Map Search for further details.

in the top right corner allows you to change the background map. By default a landscape map based on OpenStreetMap by Thunderforest is active. Other options are satellite/aerial photographs from Esri and the standard OpenStreetMap.

Sidebar

Each map has a list of the cemetery's graves (and other "non grave" features such as strayfinds, pits, deposits etc.) on the left side. Please note that this sidebar is automatically toggled on small screens and disabled on mobile devices.

If a grave's location is not documented then this icon is displayed next to the name.

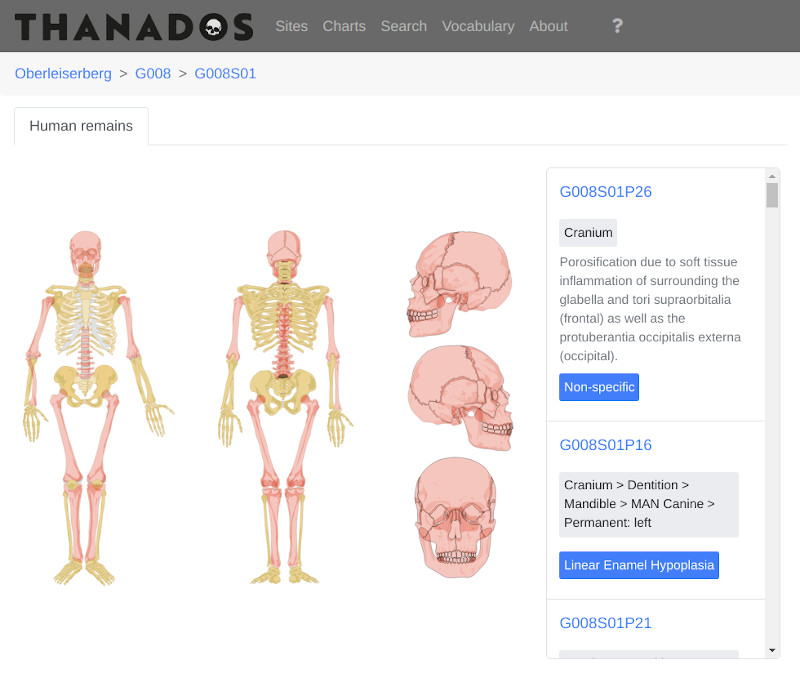
By clicking the name in the sidebar further information on the grave and the contained burials and finds are shown. Also the respective grave is highlighted on the map.
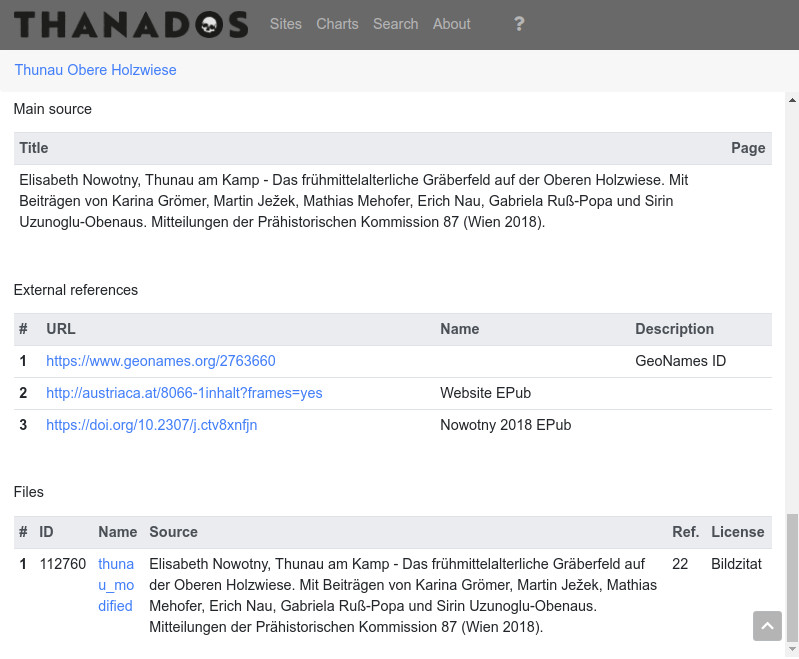
The button opens a detailed summary of the grave's catalogue entry along with all available images of the features and finds.


Search

opens a dialog for detailed searches inside the selected cemetery. In the first step you can select the level on which you want to search:

  • Graves: all properties connected to the grave (e.g. length, height/depth, azimuth, grave construction etc.)
  • Burials: all properties connected to the burial (e.g. anthropology, sex, orientation of the skeleton)
  • Finds: all properties connected to the finds (e.g. types, material, dimensions, position of find in grave etc.)
  • Osteology: all properties connected to individual bones (e.g. diseases, fractures etc.)

The next step lets you choose the criteria you want to search for:

  • Maintype: Filter for the main classification of the entity.
  • Properties: All "type" like properties and attributes aside from the main type that are connected to the entity.
  • Timespan: Lets you define a time range filter with earliest begin and latest end between which the entity has its chronological range.
  • Dimensions: Filter for certain dimensions (minimum and maximum) that the respective entity has.
  • Material: Filter for certain materials that the entity consists of. You can also define a minimum and maximum (weight percentage) like between 90% and 100% copper that the respective entity should have.
  • Value properties: Filter for certain properties that are connected with a value. E.g. the property "maximum age" of an individual that ranges between two user defined values.

If you select maintype, properties, material or value properties another dialog will open that allows you to select the respective category. This is achieved via a hierarchical property tree. You can expand the tree branches by clicking the triangle button left to the property name. Also you can enter the search term in the text box on top. Click on select once the desired node has been clicked. Selecting one property in the tree will also include all sub-properties of this very category in your search results. E.g. choosing "Attack Weapons" in the "maintype" selection for finds will also include all entries like "Swords", "Arrowheads" etc. for your search result.

If you filter by dimensions you can select the respective dimension from a dropdown and then define the minimum and maximum values.

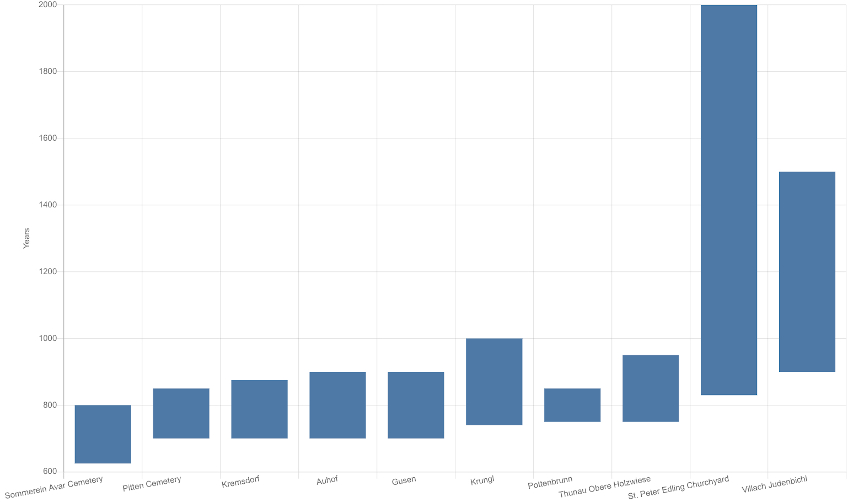
If you filter by timespan you can define the minimum and maximum years (CE). For years before year 0 just prepend a minus " - " to the number.

Once your search delivers results, this is displayed in the search dialog. Also if there are no results for your parameters. Now you can inspect the list of results (where you can also download the results as CSV list file), add the search results as layer to the map , or add another combined search that will result in an intersection of the existing search results and your new parameters. You can also reset your search anytime by clicking .

Layers

At the right bottom of the map a legend is shown with all layers that are currently added to your map. By clicking the respective layer, Layer options will be opened in a separate window. To the left side of this window, several icons for further options are listed:

opens the Layer overview with Information on "Legend title",the underlying search "Parameters" and the total count of "Results". Furthermore, the result categories can also be viewed in a dropdown menu. Here you can also see which Display possibilities are given for the respective layer: "Single color", "Multiple color", "Gradient color" and "Chart markers". Only the options that are available for the respective search result are shown. Some search results for example do not allow for multiple colors or for gradient colors, as there are no multiple result categories respectively no values that can be styled with gradient colors.

opens the Single color layer options. This displays all graves, in which the result occurs, the same way. You can adjust Legend title as well as Fill color, Opacity, Border color, Border width and Radius. You can select between point layer or polygon layer. Radius applies only to the point layer.

opens the Multiple color layer options. If your search for a certain category that includes sub-categories delivers distinctive results, these can be displayed in different colours. 
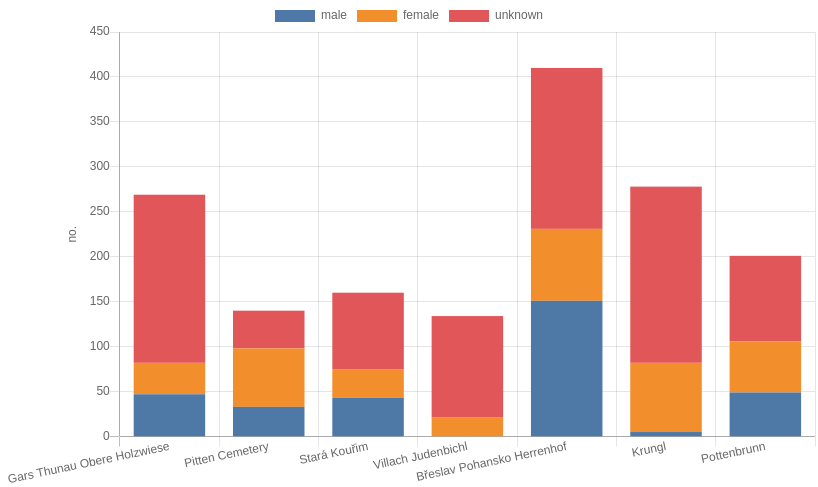
E.g. a search for all burials that have a "sex" property would result in female as well as in male burials. These differing categories can be displayed with different colours then.

You can adjust the Legend title, Opacity, Border color, Border width and Radius. The colours are created automatically. You can set a specific colour for each distinctive category individually here, by clicking on the color field of the respective category.

Please note, that the colours apply to the grave level. So if there are multiple results in one grave, only one colour/category can be visualised per grave. If you want to compare these multiple categories, you could narrow your search by selecting more detailed search parameters/sub-categories and add this searches as new layers separately.


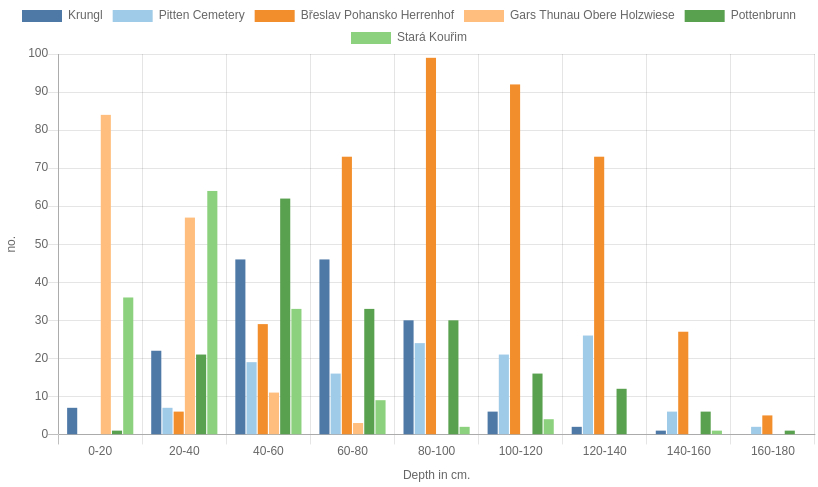
opens the Gradient color layer 
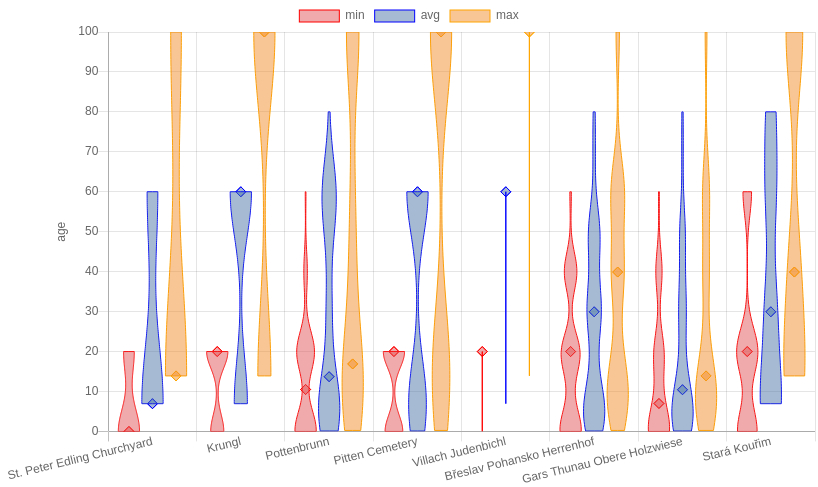
options. This option can be applied to searches for certain values. E.g. a search for the depth of graves would result in a value (depth in cm.) for each grave. These values can then be visualised with gradient colours.

Also if your search delivers more than one result per grave, you can visualise the count of these results per grave this way by selecting count instead of value in the color value select box. Please note that only available select options are shown. If your result does not include values, this option is not selectable.

Here once again you can adjust Legend title, Opacity, Border color and Border width. Additionally, you can also set a Color range between two chosen colours, by clicking on the color fields, and the number of colour Steps in between.

You can select between a Point or Polygon representation. If your choose "Point" you can also select between "single size", which will display the result as points with gradient colours. Radius lets you adjust their size. Gradient Size will display the points with a gradually increasing size, according to the given Radius min/max and corresponding to the colour gradient. If you want to display the results as points with gradient size in only one colour simply set the colour range start and end to the same colour.

Technically these visualisations are based on the Leaflet Choropleth plugin. The selectable methods for computing the colours are quantile, equidistant or k-means.

opens the Chart Markers layer options. If there are multiple results per grave for your search, this can be displayed as pie chart markers. This will show a pie chart with sections in various sizes according to the category and its count per grave.

You can adjust Legend title, Opacity, Radius and Border width. Additionally, you can also set the Bar thickness of the chart markers. Again, you can set a specific colour for each category individually here, by clicking on the color field of the respective category.

Technically these visualisations are based on the Leaflet Data Visualisation Framework.

To visualise the chosen options as described above on the map, the following buttons can be clicked, where applicable, shown to the bottom of the respective window:

visualises the respective results as point layer.

visualises the respective results as polygon layer.

visualises the respective results, where applicable, as chart-marker layer.


Additionally, you have the following options:

opens a new window with a list of the search results. By clicking the Export CSV button at the bottom of the list, you can export the data as CSV list file.

allows you to download the search results as GeoJSON geodata. You can choose between "Polygons" respectively "Points".

duplicates the layer and adds it to the map a second time with a different colour.

deletes the respective layer from the map.


  • In the legend, you can use drag and drop to move the respective layers up or down in the legend and change their display order.
  • You can toggle the visibility and minimise/maximise the legend entries.
  • To access the layer options of a certain layer, depending on its type you need to either click the color or the symbol.

Charts

With THANADOS you can visualise certain attributes of the cemeteries with various pre-defined charts respectively plots.

The filter/select menu on the top opens a list with all sites that contain at least one grave. Here you can select certain cemeteries by clicking on the respective switch to the left. By default ten cemeteries among those with the highest number of graves are selected. The switch in the header of the table turns all sites on/off.

You can filter the list by entering text (e.g. names or categories) into the search field and by adjusting the “begin” and “end” timespans of the respective sites with the time sliders. Furthermore, you also can sort the site list by clicking the header. Please note that filtering the table (e.g. by using the time sliders or search categories) will hide sites from the table even if they are selected. Hidden entries that are selected will stay selected until they are switched of.

The list length can be adjusted at the top and you can select the list pages at the bottom of the list. The selected sites are listed in the box at the bottom. By clicking on the apply button charts based on data of these sites will be created.

maximises the respective chart.

You can turn datasets on or off by clicking the legend entries. If you hover the cursor over a certain plot element additional information is shown.

Σ visualises the data as absolute values.

% visualises the data with percentage values.

Violin visualises the data where applicable as violin plot.

Boxplot visualises the data where applicable as boxplot.

For creating the charts THANADOS uses charts.js. Boxplot and violin visualisations utilise the Box and Violin Plot module.

offers you to download the chart as jpg with white background respectively as png file with transparent background.

displays information on the copyright respectively a recommendation on how to cite this chart.

Depth of graves

Here the count of graves with a certain depth is visualised as bars in 20 centimeter steps. Each cemetery is assigned an automatically defined colour.

Depth of graves

Chronology of sites

Each site is represented by a bar showing its approximate chronological begin and end. You can use the buttons to sort the plot by the begin respectively end dates or change the display order from right to left/left to right.

Chronology of Sites

Sex of individuals

Here for each cemetery an individual column is created showing the number of female/male burials and burials with unknown sex.

Sex of individuals

Orientation of skeletons

Here the count of skeletons with a certain orientation is visualised as columns in 20 degree steps. The degrees refer to the orientation of the skeleton's axis (head to feet):

  • north-south: 0°/360°
  • east-west: 90°
  • south-north: 180°
  • west-east: 270°
Orientation of skeletons

Azimuth of gravepits

Here the count of gravepits with a certain orientation is visualised as columns in 10 degree steps. The orientations are automatically calculated from the polygons of the gravepits. The degrees refer to the deviation of the grave from north. For this calculation only the orientation of the gravepit is regarded, not that of the burials inside. Thus only a deviation ranging from 0 to 180 degrees is given here. The azimuth is automatically calculated using PostGIS ST_OrientedEnvelope in combination with ST_ApproximateMedialAxis and ST_Azimuth.

  • north-south/south-north: 0°/180°
  • east-west/west-east: 90°
Azimuth of gravepits

Age at death

Here for each cemetery boxplots respectively violin plots are created representing the age at death distribution. The underlying data comes from categories given in the respective publications. The categories are mapped to the following values:

  • Child: 0 until 13.9 years
    • Fetus: -0.75 until 0 years
    • Neonatus: 0 until 0.25 years
    • Infans I-II: 0 until 13.9 years
      • Infans I: 0 until 6.9 years
      • Infans II: 7 until 13.9 years
  • Juvenil: 14 until 19.9 years
  • Juvenil-Early Adult: 14 until 24.9 years
  • Early Adult: 18 until 25 years
  • Grown up: 20 until 100 years
    • Adult: 20 until 39.9 years
    • Adult-Matur: 20 until 59.9 years
    • Matur 40: until 59.9 years
    • Matur-Senil: 40 until 100 years
    • Senil: 60 until 100 years

Three columns are created for each cemetery. The minimum age is indicated in red, the average age in blue and the maximum age in orange. The values represent the first or last value of the age range as listed above, respectively the average between the two of them. Additionally, you can choose between displaying the data as violin plot or as a boxplot.

Age at death

Types of features

Here for each cemetery an individual column is created indicating the different types of features, usually the types of graves (e.g. single grave, grave with multiple burials, urn-burial), encountered at the chosen sites. The columns show the distribution of the different types for the respective cemetery, optionally in absolute or percentage values. Each feature type is assigned an automatically defined colour.

Types of features

Grave construction

Here for each cemetery an individual column is created indicating the different types of grave construction (e.g. stone placement, earth pit, wooden coffin, cut in rock), encountered at the chosen sites. The columns show the occurrence of the different types of construction for the respective cemetery, optionally in absolute or percentage values. These are not excluding criteria, a grave can be assigned several construction types, for example a grave cut into the rock with wooden coffin and stone placement. Each feature type is assigned an automatically defined colour.

Grave construction

Types of finds

Here for each cemetery an individual column is created indicating the different types of finds (e.g. knife, pottery, riding equipment, weapon), encountered at the chosen sites. The columns show the occurrence of the different types of finds for the respective cemetery, optionally in absolute or percentage values. Each type of find is assigned an automatically defined colour.

Types of finds

Burial types

Here for each cemetery an individual column is created indicating the different types of burials or stratigraphic units that the features/graves are composed of (e.g. skeleton, cremation, bone deposition), encountered at the chosen sites. The columns show the occurrence of the different types of burials for the respective cemetery, optionally in absolute or percentage values. Each type of burial is assigned an automatically defined colour.

Burial types

Vocabulary

THANADOS links various properties, classifications, types and values with the recorded entities to document their attributes. They are divided into four different "type" classes:

  • Classifications: Each entity of a certain level (site, grave, burial and find) is defined by one functional type that explains what the entity represents. Eg. "Inumation cemetery" as classification of a site or "Sword" as classifictaion for a find.
  • Standard: Properties of non archaeological entities (e.g. file license, type of publications)
  • User defined: Categories defined in the backend by users who enter data and want to "tag" archaeological entities with them.
  • Value types: "Tags" that are additionally linked with a certain value and a unit (e.g. dimensions, weight, measurements, count)

The Vocabulary page lists all contained types and gives an overview on their hierarchy, usage and linked entities. Selecting the respective tab displays the top level types that are available. You can expand them by clicking the heading. Here you find further information and the type hierarchy.

opens a popover with detailed information on the selected type.

Each type also has its own page with a permanent link. This page can be accessed from within THANADOS by clicking the property buttons for example in the detailed view, via the info pop-up in the map respectively from the links in the vocabulary hierarchy.

License / Citation

Wherever possible, THANADOS provides its content under a Creative Commons Attribution 4.0 International License. For a recommendation on how to cite the respective entity and detailed information, a quotation icon will provide detailed information.

Please note that this licence applies only to the information respectively the dataset represented within THANADOS. This data was derived from various sources that are documented in the metadata section of each entity. We recommend to cite them as well. Feel free to adapt the citation to your needs for the publishing medium you are using. When doing so, please make sure to follow the Creative Commons attribution guidelines.

For digital objects that are displayed here from other sources (e.g. map tiles, images), other rights respectively licences might apply. For using them in your own work, make sure to possess the necessary rights and cite the original creators properly.

Network Visualisation

Within the detailed view of each entity you can access a network visualisation or the respective entity by clicking

network2

This will open a page where the respective network is displayed. The selected entity is represented by the central and largest node. A legend explains the various other nodes.

The entity, its sub- and superunits, classifications, files and references are visualised as an interctive network.

network

You can drag nodes, navigate and zoom in/out using the mouse / mouse wheel. Double clicking a node will open the detailed view of the represented entity.

Data Model

The THANADOS data is structured in a four level hierarchy (site, grave, burial and find). The site respectively the cemetery itself is the superior unit and works as a data container for all subunits.

On the second level the observed archaeological features the graves are dealt with. They are again a data container for information on connected stratigraphic units, in our case the burials, which are in turn a container for further data on physical objects, here the individual finds, assigned to the respective burials.

All those entities, whether sites, graves, burials or finds are of course associated with certain other information, thus, they can each be opened as detailed view page, all structured in the same way, as explained above.

hierarchy

Additionally, if a stratigraphic unit contains osteology data for individual bones, these can be recorded e.g. as single bones with specific properties like pathologies, preservation etc. A skeleton/burial therefore can be a container of the bones it comprises. This way various attributes that apply not to the whole skeleton but only to parts of it can be differentiated down to the level of each single bone.

As THANADOS uses OpenAtlas as backend for the data acquisition all underlying data are mapped as a network defined by classes and properties of the CIDOC CRM. If you want to learn more about the backend data mappings see the OpenAtlas documentation.

Export Formats

THANADOS allows for exporting the provided data in various open formats. This way they can be used for further analyses, visualisations and any kind of research in other (software) environments.

Please consider the respective copyright/license and cite the source when using these data for your own work.

CSV

CSV search within a cemetery (intrasite) or from the intersite search as CSV files. They can be used e.g. in spreadsheet software like Microsoft Excel or LibreOffice Calc as well as in GIS or statistical software.

Depending on your search parameters the following information is exported from an intrasite search:

  • Site name and site id
  • Search result object name, id and classifications
  • Search result category and path
  • Search result value and unit (if search included values)
  • Timespan of search result object
  • Grave name, type and id
  • Geometry of the containing grave as WKT (Well Known Text) in WGS 84 decimal degrees (EPSG 4326)
  • Easting and Northing of the containing grave's centerpoint in WGS 84 decimal degrees

Intersite search:

  • Search result object id, name and classifications
  • Search result category name, id, values and path
  • Context and context ids (Site, Grave, Burial)
  • Easting and Northing of the containing site's centerpoint in WGS 84 decimal degrees

GeoJSON

detailed view of each entity

  • the map layers menu
  • the intersite search map
  • Images

    From within THANADOS it is possible to export various elements as image files:

    • Single cemetery maps
    • Search result maps
    • Charts